|
 |
Analysis of Semiconductor Thin Films – A Few Examples (Ref: Ellipso Technology) |
|
| |
|
|
| |
|
 |
|
|
| |
1-1. SiO2 on c-Si |
| |
| Thickness |
106.234 nm |
| R.I. (@633 nm) |
1.5302 |
| Substrate |
Crystalline Silicon |
|
| |
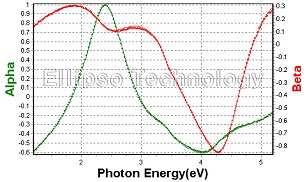
 Thickness and refractive index of SiO2 film on c-Si substrate obtained by analyzing spectro-ellipsometric data. Thickness and refractive index of SiO2 film on c-Si substrate obtained by analyzing spectro-ellipsometric data. |
|
| |
 |
| |
 The measured ellipsometric spectra of alpha and beta (symbols) and the best fit ones(lines) are compared. The measured ellipsometric spectra of alpha and beta (symbols) and the best fit ones(lines) are compared. |
|
| |
1-2. Mapping of SiO2 Film Thickness on c-Si |
| |
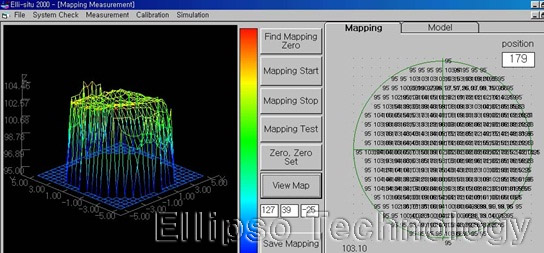
Surface Mapping of Oxide Thickness
(SiO2 on c-Si, Thickness = 100 nm) |
| |
 Captured image of SiO2 film thickness map. Captured image of SiO2 film thickness map. |
|
| |
1-3. SiO2 on SiC(SiC 표면을 산화시켜 SiO2층 생성) |
| |
| Thickness : SiO2 1299.946 nm |
| R.I. : Dispersion of SiO2 |
| Substrate : Silicon Carbide |
|
|
 |
|
|
| |
2-1. Low Density Thin Al2O3 on c-Si (1/2) |
| |
| Thickness |
5.584 nm |
| R.I. (@633 nm) |
1.507 |
| Substrate |
Crystalline Silicon |
|
| |
 Thickness and refractive index of very thin Al2O3 film on c-Si substrate obtained by analyzing spectro-ellipsometric data. Thickness and refractive index of very thin Al2O3 film on c-Si substrate obtained by analyzing spectro-ellipsometric data. |
|
| |
 |
| |
 The measured ellipsometric spectra of Δ and ψ(symbols) and the best fit ones(lines) are compared The measured ellipsometric spectra of Δ and ψ(symbols) and the best fit ones(lines) are compared |
|
| |
2-2. Low Density Thin Al2O3 on c-Si (2/2) |
| |
| Thickness |
21.198 nm |
| R.I. (@633 nm) |
1.669 |
| Substrate |
Crystalline Silicon |
|
| |
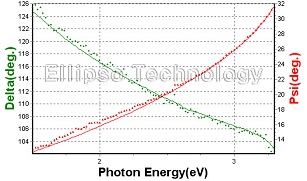
 Thickness and refractive index of thin Al2O3 film on c-Si substrate obtained by analyzing spectro-ellipsometric data. Thickness and refractive index of thin Al2O3 film on c-Si substrate obtained by analyzing spectro-ellipsometric data. |
|
| |
 |
| |
 The measured ellipsometric spectra of Δ and ψ(symbols) and the best fit ones(lines) are compared. The measured ellipsometric spectra of Δ and ψ(symbols) and the best fit ones(lines) are compared. |
|
| |
2-3. Mapping of Al2O3 Film Thickness |
| |
| Diameter(mm) |
100 |
| Measurement Count |
25/25 |
| Thickness Average(nm) |
37.83 |
| Thickness S.D.(nm) |
0.085 |
| Refractive Index Average |
1.687 |
| Refractive Index S.D. |
0.001 |
|
|
| |
 |
| |
 2D thickness map of Al2O3 film on c-Si. 2D thickness map of Al2O3 film on c-Si. |
|
 |
|
|
| |
3-1. SiN on c-Si |
| |
| Thickness |
85.863 nm |
| R.I. (@633 nm) |
2.0527 |
| Substrate |
Crystalline Silicon |
|
| |
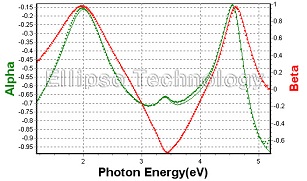
 Thickness and refractive index of SiN film on c-Si substrate obtained by analyzing spectro-ellipsometric data. Thickness and refractive index of SiN film on c-Si substrate obtained by analyzing spectro-ellipsometric data. |
|
| |
 |
|
| |
 The measured ellipsometric spectra of alpha and beta(symbols) and the best fit ones(lines) are compared. The measured ellipsometric spectra of alpha and beta(symbols) and the best fit ones(lines) are compared. |
|
| |
3-2. SiN/SiO2 on c-Si |
| |
 |
| |
| Si3N4 Thickness |
219.3 nm |
| SiO2 Thickness |
223.8 nm |
| Substrate |
Crystalline Silicon |
|
|
|
| |
3-3. Si-rich SiN on c_Si |
| |
 |
| Si-rich SiN Film |
| Composition Si3N4 (85.8 %) + a-Si (14.2 %) |
| Thickness 51.5 nm |
R.I.(@ 633 nm) 2.294,
Extinction Coeff.(@ 633 nm) 0.018 |
|
| |
| R.I Dispersion |
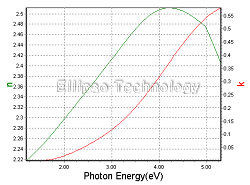 |
| |
|
|
|
| |
3-4. Low Density SiN on c_Si |
| |
 |
| |
| Si3N4 |
|
Density
R.I.(@633 nm)
Thickness
|
83.0 %
1.840
87.0 nm |
| Substrate |
Crystalline Silicon |
|
|
|
| |
3-5. SiNx on Glass |
| |
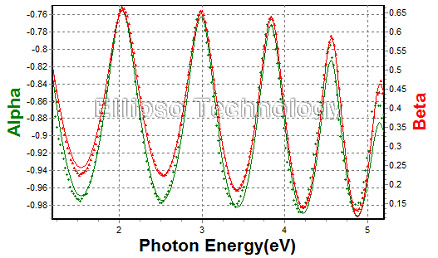 |
| SiNx Thickness : 372.74 nm |
| R.I. (@633 nm) : 1.8823 |
| Substrate : Glass |
|
|
|
 |
4. Poly(Boron+Carbon) |
[TOP] |
|
|
| |
4-1. Poly(Boron+Carbon)/SiO2 on c-Si |
| |
Thickness, Poly
SiO2 |
105.99 nm
100.00 nm |
| R.I. |
Dispersion of Poly |
| Substrate |
Crystalline Silicon |
|
 |
|
| |
 Thickness and refractive index dispersion of Poly composed of Boron and Carbon on c-Si with oxide obtained by analyzing spectro-ellipsometric data. Thickness and refractive index dispersion of Poly composed of Boron and Carbon on c-Si with oxide obtained by analyzing spectro-ellipsometric data. |
| |

|
| |
 The measured ellipsometric spectra of alpha and beta(symbols) and the best fit ones(lines) are compared. The measured ellipsometric spectra of alpha and beta(symbols) and the best fit ones(lines) are compared. |
|
 |
|
|
| |
5-1. SrOx/SiO2 on c-Si(1/2) |
| |
Thickness, SrOx
SiO2 |
7.827 nm
2.0 nm |
| R.I. |
Dispersion of SrOx |
| Substrate |
Crystalline Silicon |
|
 |
|
| |
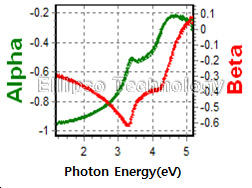
 Thickness and refractive index of SrOx film on c-Si substrate with native oxide obtained by analyzing spectro-ellipsometric data. Thickness and refractive index of SrOx film on c-Si substrate with native oxide obtained by analyzing spectro-ellipsometric data. |
| |
 |
| |
 The measured ellipsometric spectra of alpha and beta(symbols) and the best fit ones(lines) are compared. The measured ellipsometric spectra of alpha and beta(symbols) and the best fit ones(lines) are compared. |
|
| |
5-2. SrOx/SiO2 on c-Si(2/2) |
| |
Thickness, SrOx
SiO2 |
2.854 nm
2.0 nm |
| R.I. |
Dispersion of SrOx |
| Substrate |
Crystalline Silicon |
|
 |
|
| |
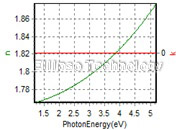
 Thickness and refractive index of SrOx film on c-Si substrate with native oxide obtained by analyzing spectro-ellipsometric data. Thickness and refractive index of SrOx film on c-Si substrate with native oxide obtained by analyzing spectro-ellipsometric data. |
| |
 |
| |
 The measured ellipsometric spectra of alpha and beta(symbols) and the best fit ones(lines) are compared. The measured ellipsometric spectra of alpha and beta(symbols) and the best fit ones(lines) are compared. |
|
| |
5-3. SrOx on Ru |
| |
| Thickness, SrOx |
11.675 nm |
| R.I. |
Dispersion of Ru |
| Substrate |
Ruthenium |
|
 |
|
| |
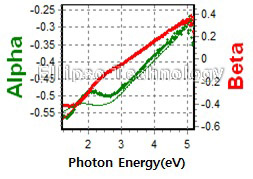
 Thickness of SrOx film on Ru substrate and refractive index of Ru obtained by analyzing spectro-ellipsometric data. Thickness of SrOx film on Ru substrate and refractive index of Ru obtained by analyzing spectro-ellipsometric data. |
| |
 |
| |
 The measured ellipsometric spectra of alpha and beta(symbols) and the best fit ones(lines) are compared. The measured ellipsometric spectra of alpha and beta(symbols) and the best fit ones(lines) are compared. |
|
 |
|
|
| |
6-1. HfOx on c-Si |
| |
| Thickness, HfOx |
14.999 nm |
| R.I. |
Dispersion of HfOx |
| Substrate |
Crystalline Silicon |
|
 |
|
| |
 Thickness and refractive index of HfOx film on c-Si substrate obtained by analyzing spectro-ellipsometric data. Thickness and refractive index of HfOx film on c-Si substrate obtained by analyzing spectro-ellipsometric data. |
| |
 |
| |
 The measured ellipsometric spectra of alpha and beta(symbols) and the best fit ones(lines) are compared. The measured ellipsometric spectra of alpha and beta(symbols) and the best fit ones(lines) are compared. |
|
 |
|
|
| |
7-1. ATO on c-Si |
| |
| Thickness, ATO |
30.537 nm |
| R.I. |
Dispersion of ATO |
| Substrate |
Crystalline Silicon |
|
 |
|
| |
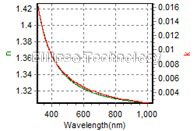
 Thickness and refractive index of ATO film on c-Si substrate obtained by analyzing spectro-ellipsometric data. Thickness and refractive index of ATO film on c-Si substrate obtained by analyzing spectro-ellipsometric data. |
| |
 |
| |
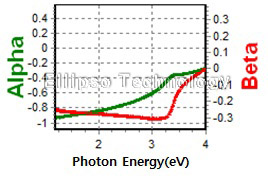
 The measured ellipsometric spectra of alpha and beta(symbols) and the best fit ones(lines) are compared. The measured ellipsometric spectra of alpha and beta(symbols) and the best fit ones(lines) are compared. |
|
 |
|
|
| |
8-1. PMMA on c-Si |
| |
| Thickness, PMMA |
197.374 nm |
| R.I. |
Dispersion of PMMA |
| Substrate |
Crystalline Silicon |
|
 |
|
| |
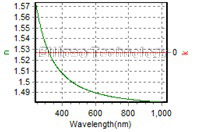
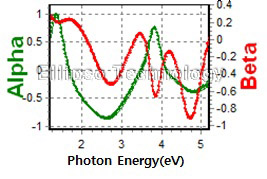
 Thickness and refractive index of PMMA film on c-Si substrate obtained by analyzing spectro-ellipsometric data. Thickness and refractive index of PMMA film on c-Si substrate obtained by analyzing spectro-ellipsometric data. |
| |
|
| |
 The measured ellipsometric spectra of alpha and beta(symbols) and the best fit ones(lines) are compared. The measured ellipsometric spectra of alpha and beta(symbols) and the best fit ones(lines) are compared. |
|
 |
|
|
| |
9-1. Si/SiGe20 on c-Si |
| |
Thickness, Si
SiGe20 |
160.257 nm
56.159 nm |
| R.I. |
Dispersion of SiGe20 |
| Substrate |
Crystalline Silicon |
|
 |
|
| |
 Thickness and refractive index of Si/SiGe20 film on c-Si substrate obtained by analyzing spectro-ellipsometric data Thickness and refractive index of Si/SiGe20 film on c-Si substrate obtained by analyzing spectro-ellipsometric data |
| |

|
| |
 The measured ellipsometric spectra of alpha and beta(symbols) and the best fit ones(lines) are compared. The measured ellipsometric spectra of alpha and beta(symbols) and the best fit ones(lines) are compared. |
|
 |
|
|
| |
10-1. AZO on Glass |
| |
| Layers (From Top) |
AZO (84 %) + vod (16 %) = 35.24 nm
AZO = 1098.36 nm |
| Substrate |
Glass |
|
| |
 Thickness of AZO film with its microrough surface on glass substrate obtained by analyzing spectro-ellipsometric data. Thickness of AZO film with its microrough surface on glass substrate obtained by analyzing spectro-ellipsometric data. |
|
| |
 |
|
| |
 The measured ellipsometric spectra of alpha and beta(symbols) and the best fit ones(lines) are compared. The graph on right shows the complex refractive index dispersion of AZO film. The measured ellipsometric spectra of alpha and beta(symbols) and the best fit ones(lines) are compared. The graph on right shows the complex refractive index dispersion of AZO film. |
|
| |
10-2. AZO/SiO2 on c-Si |
| |
Thickness, AZO
SiO2 |
301.9 nm
100.00 nm |
| R.I. |
Dispersion of AZO |
| Substrate |
Crystalline Silicon |
|
 |
|
| |
 Thickness and refractive index dispersion of AZO on c-Si with oxide obtained by analyzing spectro-ellipsometric data. Thickness and refractive index dispersion of AZO on c-Si with oxide obtained by analyzing spectro-ellipsometric data. |
| |

|
| |
 The measured ellipsometric spectra of alpha and beta(symbols) and the best fit ones(lines) are compared. The measured ellipsometric spectra of alpha and beta(symbols) and the best fit ones(lines) are compared. |
|
 |
|
|
| |
11-1. IZO on c-Si |
| |
| IZO Thickness |
136.2 nm |
| Substrate |
Crystalline Silicon |
| R.I. |
Dispersion of IZO |
|
 |
|
| |
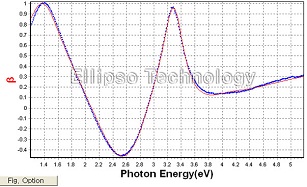
 Thickness and refractive index dispersion of IZO on c-Si obtained by analyzing spectro-ellipsometric data. Thickness and refractive index dispersion of IZO on c-Si obtained by analyzing spectro-ellipsometric data. |
|
| |
  |
| |
 The measured ellipsometric spectra of alpha and beta(symbols) and the best fit ones(lines) are compared The measured ellipsometric spectra of alpha and beta(symbols) and the best fit ones(lines) are compared |
|
 |
|
|
| |
12-1. ZnO on c-Si |
| |
Thickness, ZnO
SiO2 |
45.6 nm
105.69 nm |
| R.I. |
Dispersion of ZnO |
| Substrate |
Crystalline Silicon |
|
 |
|
| |
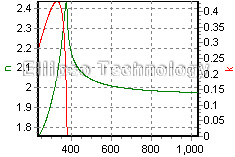
 Thickness and refractive index dispersion of ZnO on c-Si with oxide obtained by analyzing spectro-ellipsometric data. Thickness and refractive index dispersion of ZnO on c-Si with oxide obtained by analyzing spectro-ellipsometric data. |
| |
 |
| |
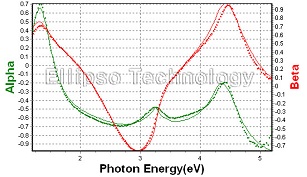
 The measured ellipsometric spectra of alpha and beta(symbols) and the best fit ones(lines) are compared The measured ellipsometric spectra of alpha and beta(symbols) and the best fit ones(lines) are compared |
|
 |
|
|
| |
13-1. IGZO on Glass |
| |
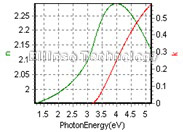
Thickness, IGZO(80%)+void(20%)
SiO2 |
8.648 nm
42.143 nm |
| R.I. |
Dispersion of IGZO |
| Substrate |
Glass |
|
 |
|
| |
 Thickness and refractive index dispersion of IGZO on glass obtained by analyzing spectro-ellipsometric data. Thickness and refractive index dispersion of IGZO on glass obtained by analyzing spectro-ellipsometric data. |
| |
 |
| |
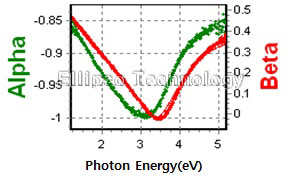
 The measured ellipsometric spectra of alpha and beta(symbols) and the best fit ones(lines) are compared The measured ellipsometric spectra of alpha and beta(symbols) and the best fit ones(lines) are compared |
|
| |
13-2. IGZO on c_Si |
| |
Thickness, IGZO
SiO2 |
62.685 nm
1.717 nm |
| R.I. |
Dispersion of IGZO |
| Substrate |
Crystalline Silicon |
|
 |
|
| |
 Thickness and refractive index dispersion of IGZO on c-Si with native oxide obtained by analyzing spectro-ellipsometric data. Thickness and refractive index dispersion of IGZO on c-Si with native oxide obtained by analyzing spectro-ellipsometric data. |
| |
 |
| |
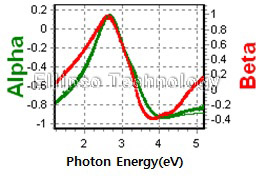
 The measured ellipsometric spectra of alpha and beta(symbols) and the best fit ones(lines) are compared The measured ellipsometric spectra of alpha and beta(symbols) and the best fit ones(lines) are compared |
|
| |
13-3. IGZO/SiO2 on c-Si |
| |
Thickness, IGZO
SiO2 |
9.716 nm
206.003 nm |
| R.I. |
Dispersion of IGZO |
| Substrate |
Crystalline Silicon |
|
 |
|
| |
 Thickness and refractive index dispersion of IGZO on c-Si with thick oxide obtained by analyzing spectro-ellipsometric data. Thickness and refractive index dispersion of IGZO on c-Si with thick oxide obtained by analyzing spectro-ellipsometric data. |
| |
 |
| |
 The measured ellipsometric spectra of alpha and beta(symbols) and the best fit ones(lines) are compared The measured ellipsometric spectra of alpha and beta(symbols) and the best fit ones(lines) are compared |
|
 |
|
|
| |
14-1. ZTO/SiO2 on c-Si |
| |
Thickness, ZTO
SiO2 |
22.631 nm
304.844 nm |
| R.I. |
Dispersion of ZTO |
| Substrate |
Crystalline Silicon |
|
|
 |
|
| |
 Thickness and refractive index dispersion of ZTO on c-Si with thick oxide obtained by analyzing spectro-ellipsometric data. Thickness and refractive index dispersion of ZTO on c-Si with thick oxide obtained by analyzing spectro-ellipsometric data. |
| |
 |
| |
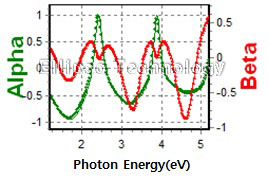
 The measured ellipsometric spectra of alpha and beta(symbols) and the best fit ones(lines) are compared The measured ellipsometric spectra of alpha and beta(symbols) and the best fit ones(lines) are compared |
|
 |
|
|
| |
15-1. TiO2 on Gkass(1/2) |
| |
| Layers (From Top) |
TiO2 (27 %) + vod (73 %) = 11.42 nm
TiO2 = 30.58 nm |
| Substrate |
Glass |
|
| |
 Thickness of TiO2 film with its microrough surface on glass substrate obtained by analyzing spectro-ellipsometric data. Thickness of TiO2 film with its microrough surface on glass substrate obtained by analyzing spectro-ellipsometric data. |
|
| |
 |
| |
 The measured ellipsometric spectra of alpha and beta(symbols) and the best fit ones(lines) are compared. The graph on right shows the complex refractive index dispersion of TiO2 film The measured ellipsometric spectra of alpha and beta(symbols) and the best fit ones(lines) are compared. The graph on right shows the complex refractive index dispersion of TiO2 film |
|
| |
15-2. TiO2 on Gkass(2/2) |
| |
| TiO2 Thickness |
38.1 nm |
| Substrate |
Glass |
|
|
| |
  |
|
| |
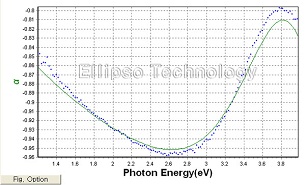
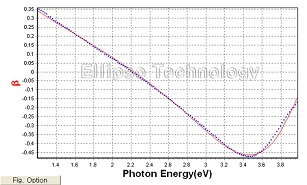
 The measured ellipsometric spectra of alpha and beta(symbols) and the best fit ones(lines). The measured ellipsometric spectra of alpha and beta(symbols) and the best fit ones(lines). |
|
| |
15-3. Ag Doped TiO2 on Glass |
| |
| Thickness : 157.65 nm |
| Substrate : Glass |
| R.I. Dispersion |
|
|
| |
15-4. Co Doped TiO2 on Glass |
| |
| Thickness : 165.65 nm |
| Substrate : Glass |
| R.I. Dispersion |
|
|
 |
16. ZrO2/SiO2 Multilayer |
[TOP] |
|
|
| |
16-1. ZrO2/SiO2 Multilayer on c_Si |
| |
| Layers from Top |
|
| SiO2 |
92.6 nm |
| ZrO2 (96.0 %) + void (4.0 %) |
63.8 nm |
| SiO2 |
12.7 nm |
| ZrO2 (92.6 %) + void (7.4 %) |
28.6 nm |
| SiO2 |
114.9 nm |
| SiO2 (93.8 %) + c-Si (6.2 %) |
6.2 nm |
| Substrate |
Crystalline Silicon |
|
| |
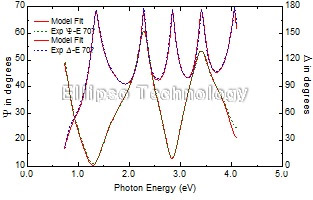
 Thickness and volume density of alternatively deposited SiO2 and ZrO2 multilayers on c-Si substrate are determined by analyzing spectro-ellipsometric data. Thickness and volume density of alternatively deposited SiO2 and ZrO2 multilayers on c-Si substrate are determined by analyzing spectro-ellipsometric data. |
|
| |
 |
| |
 The measured ellipsometric spectra of Δ and ψ(dashed lines) and the best fit ones(solid lines) are compared. The measured ellipsometric spectra of Δ and ψ(dashed lines) and the best fit ones(solid lines) are compared. |
|
 |
17. ZnS-SiO2 on c-Si vs O2 Flow Rate |
[TOP] |
|
|
| |
 |
| |
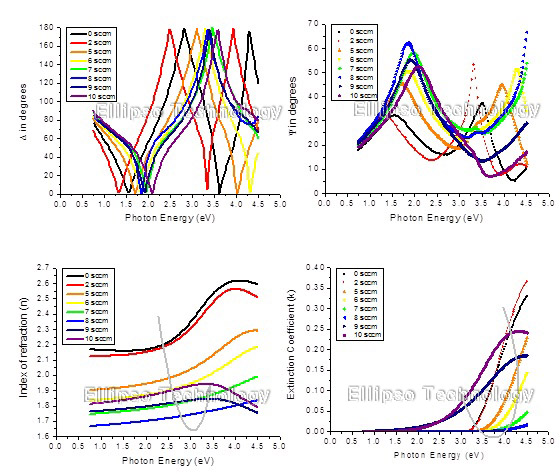
 Dependence of optical property of sputter grown ZnS-SiO2 film on Oxygen flow rate. Dependence of optical property of sputter grown ZnS-SiO2 film on Oxygen flow rate. |
|
 |
18. Depth Profiling of Si+ Implanted Si |
[TOP] |
|
|
| |
 |
|
| |
 Comparison of X-TEM and SE for depth profiling of Si+ ion implanted silicon shows that results are in Comparison of X-TEM and SE for depth profiling of Si+ ion implanted silicon shows that results are in
excellent agreement each other. |
|
| |
 |
|
| |
 Comparison between the experimentally measured (Δ, ψ) data and the calculated data using the model Comparison between the experimentally measured (Δ, ψ) data and the calculated data using the model
shown above. (Vedam et al., App. Phys. Lett. 47(4) 339, 1985) |
|
 |
19. Depth Profiling of Oxygen Ion Implanted Silicon |
[TOP] |
|
|
| |
19-1. Depth Profiling of Oxygen Ion Implanted Silicon-on-Insulator(1/2) |
| |
 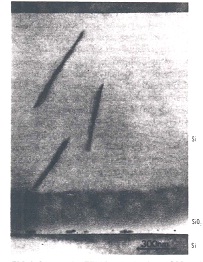 |
| |
 Spectro-ellipsometric spectrum of tan(Psi) and the X-TEM image of an Oxygen ion implanted silicon. The measured spectro-ellipsometric constants are shown as dots and the best fit spectrum as a line. Spectro-ellipsometric spectrum of tan(Psi) and the X-TEM image of an Oxygen ion implanted silicon. The measured spectro-ellipsometric constants are shown as dots and the best fit spectrum as a line. |
|
| |
| Layers (From Top) |
SiO2 (71 %) + Si (29 %) 1.55 nm
c-Si (96 %) + SiO2 (4 %) 1406 nm
c-Si (47 %) + SiO2 (53 %) 5.0 nm
SiO2 285.2 nm
c-Si (64 %) + SiO2 (36 %) 23.5 nm |
| Substrate |
Crystalline Silicon |
|
| |
 Depth profiling of the above Oxygen implanted silicon sample is successfully achieved as a result of the modeling analysis SE data. (Narayan et al., App. Phys. Lett. 51(5) 343, 1987) Depth profiling of the above Oxygen implanted silicon sample is successfully achieved as a result of the modeling analysis SE data. (Narayan et al., App. Phys. Lett. 51(5) 343, 1987) |
|
| |
19-2. Depth Profiling of Oxygen Ion Implanted Silicon-on-Insulator(2/2) |
| |
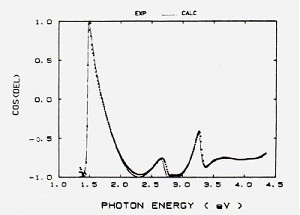 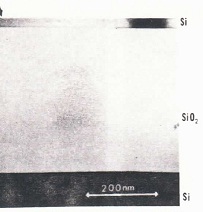 |
| |
 Spectro-ellipsometric spectrum of cos(Delta) and the X-TEM image of an Oxygen ion implanted silicon. The measured spectro-ellipsometric constants are shown as dots and the best fit spectrum as a line. Spectro-ellipsometric spectrum of cos(Delta) and the X-TEM image of an Oxygen ion implanted silicon. The measured spectro-ellipsometric constants are shown as dots and the best fit spectrum as a line. |
|
| |
| Layers (From Top) |
SiO2 2.35 nm
c-Si (95.3 %) + SiO2 (4.7 %) 28.0 nm
SiO2 401.2nm |
| Substrate |
Crystalline Silicon |
|
| |
 Depth profiling of the above Oxygen implanted silicon sample is successfully achieved as a result of the modeling analysis SE data. (Narayan et al., App. Phys. Lett. 51(5) 343, 1987) Depth profiling of the above Oxygen implanted silicon sample is successfully achieved as a result of the modeling analysis SE data. (Narayan et al., App. Phys. Lett. 51(5) 343, 1987) |
|
 |
|
|
| |
20-1. PR on c_Si |
| |
| Thickness : PR 1423.475 nm |
| R.I. : Dispersion of PR |
| Substrate : Crystalline Silicon |
|
|
 |
|
|
| |
21-1. GST/SiO2 on c_Si(heating) |
| |
| Thickness : GST 12.322 nm |
| R.I. : Dispersion of GST |
| Substrate : Crystalline Silicon |
|
|
| |
21-2. GST/SiO2(650nm) on c_Si |
| |
| Thickness : GST 13.087 nm |
| R.I. : Dispersion of GST |
| Substrate : Crystalline Silicon |
|
|
 |
|
|
| |
22-1. Ga2O3 on c_Si |
| |
| Thickness : Ga2O3 13.184 nm |
| R.I. : Dispersion of Ga2O3 |
| Substrate : Crystalline Silicon |
|
|


